Description
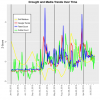
We collected data about the severity of the California drought as observed in mediated spaces from February 2013 through September 2015. Drought severity in the San Joaquin River Valley, the area of California most impacted by the drought and whose impact drove the public conversation, was measured using the Standardized Soil Moisture Index, or SSI. SSI is a variant of the precipitation index, which uses streamflow instead of direct precipitation measurements. Streamflow is captured form rivers, streams, and other flowing bodies of water, which more accurately captures the precipitation that was directly captured by the soil. Regardless of the measurement method, the two indices are nearly identical, capturing the same data, which is the amount of water that is available in an area. The standardized soil moisture index is preferable because it is weighted toward capturing land drought severity.
In measurable terms, three-month SSI was calculated at five randomly selected locations using the soil moisture data obtained from NLDAS, NASA’s North American Land Data Assimilation Systems dataset. Hourly soil moisture data from NLDAS spanning January 1980 through September 2015 was converted to monthly time series and entered the Standardized Precipitation Index calculator. Output containing the three-month SSI values was then used for further analysis. It is important to note that while SSI measures the severity of the drought, it provides only a baseline measure of how dramatic the real-life conditions were at each point during the crisis. However, by introducing the measure in the predictive model we do not assume that the media or information consumers reacted directly and consciously to it since the information was not publicly known. Rather, we consider that the worsening objective drought conditions created the environmental circumstances felt through a variety of personal experiences, especially dwindling water supplies in the homes and fields, that led to media concerns. SSI offers an assessment of the magnitude of the objective water shortage was, which created the backdrop of the crisis. SSI is the ultimate ground truth, against which we measure everything else, not a subjectively known quantity to which the human actors responded consciously.
We assessed the mediated response to the drought via the volume of Google searches related to the drought and Twitter activity and media coverage of the California water crisis. We collected data using a query algorithm with core strings “California water” and “California drought.” From Google Trends, we retrieved the volume of searches in California for “California Water” and “California Drought” for searches performed in California, which was the highest level of granularity available for this data. (Google can release a standardized index for search volume for any given period. The index is standardized on a 0-100 scale around the highest volume detected during the period of interest. Thus, the week with the highest volume is scored at 100, while everything else is calculated as a fraction of that week’s score. (This method of standardization is intended to protect Google’s commercial interest in the raw data.)
Using the Twitter Application Programming Interface (API), we retrieved the query ((climate OR drought OR water) (california OR ca)) OR cawater OR cadrought OR saveourwater. The query was more complex because it included several hashtags specific to Twitter (cawater, cadrought, and saveourwater). The pilot sampling process revealed that “climate” was also associated with the California drought crisis, further adding to query complexity. The query was limited in space to central California tweets geo-located by meta-data or in-text geographic identification. A total of 186,149 tweets were retrieved. The traditional media outlet selected was newspaper The Modesto Bee, an important regional newspaper covering the San Joaquin River Valley, the area most impacted by the crisis. The online newspaper archive was searched for articles containing the strings “California water” and “California drought” and 1,853 articles were retrieved.
Newspaper and Twitter data was cleaned for relevance and location. Non-relevant items were identified through hand-coding of a random sample of the collected items. We then applied a Multinomial Naive Bayesian algorithm to extend the classification made in the hand-coded items to the entire dataset. A Multinomial Naive Bayesian classifier uses word frequencies to characterize each document and then classifies the documents by comparing the similarity between frequency of word occurrence across documents (in this case articles of tweets). The averages of each accuracy metric with each class weighted to their prevalence in the data were:
Precision, .77, recall, .72, and F1, score .68, which are within the typical limits for reliability of this type of analysis. This is a widely used method, which provides robust results avoiding skewing the dataset with tweets related to water-heater troubles or water crises in other regions than California.
Cite this work
Researchers should cite this work as follows:
- Kulzic, R.; Sinclair Chapman, V.; Potts, L.; Matei, S. A. (2021). Data series media and ssi indices over time for California Drought Study. Purdue University Research Repository. doi:10.4231/7BHE-D060
